Enterprise-grade observability and automation monitoring
Build a resilient automation fabric with RunMyJobs by Redwood, the leading orchestration platform for the enterprise.
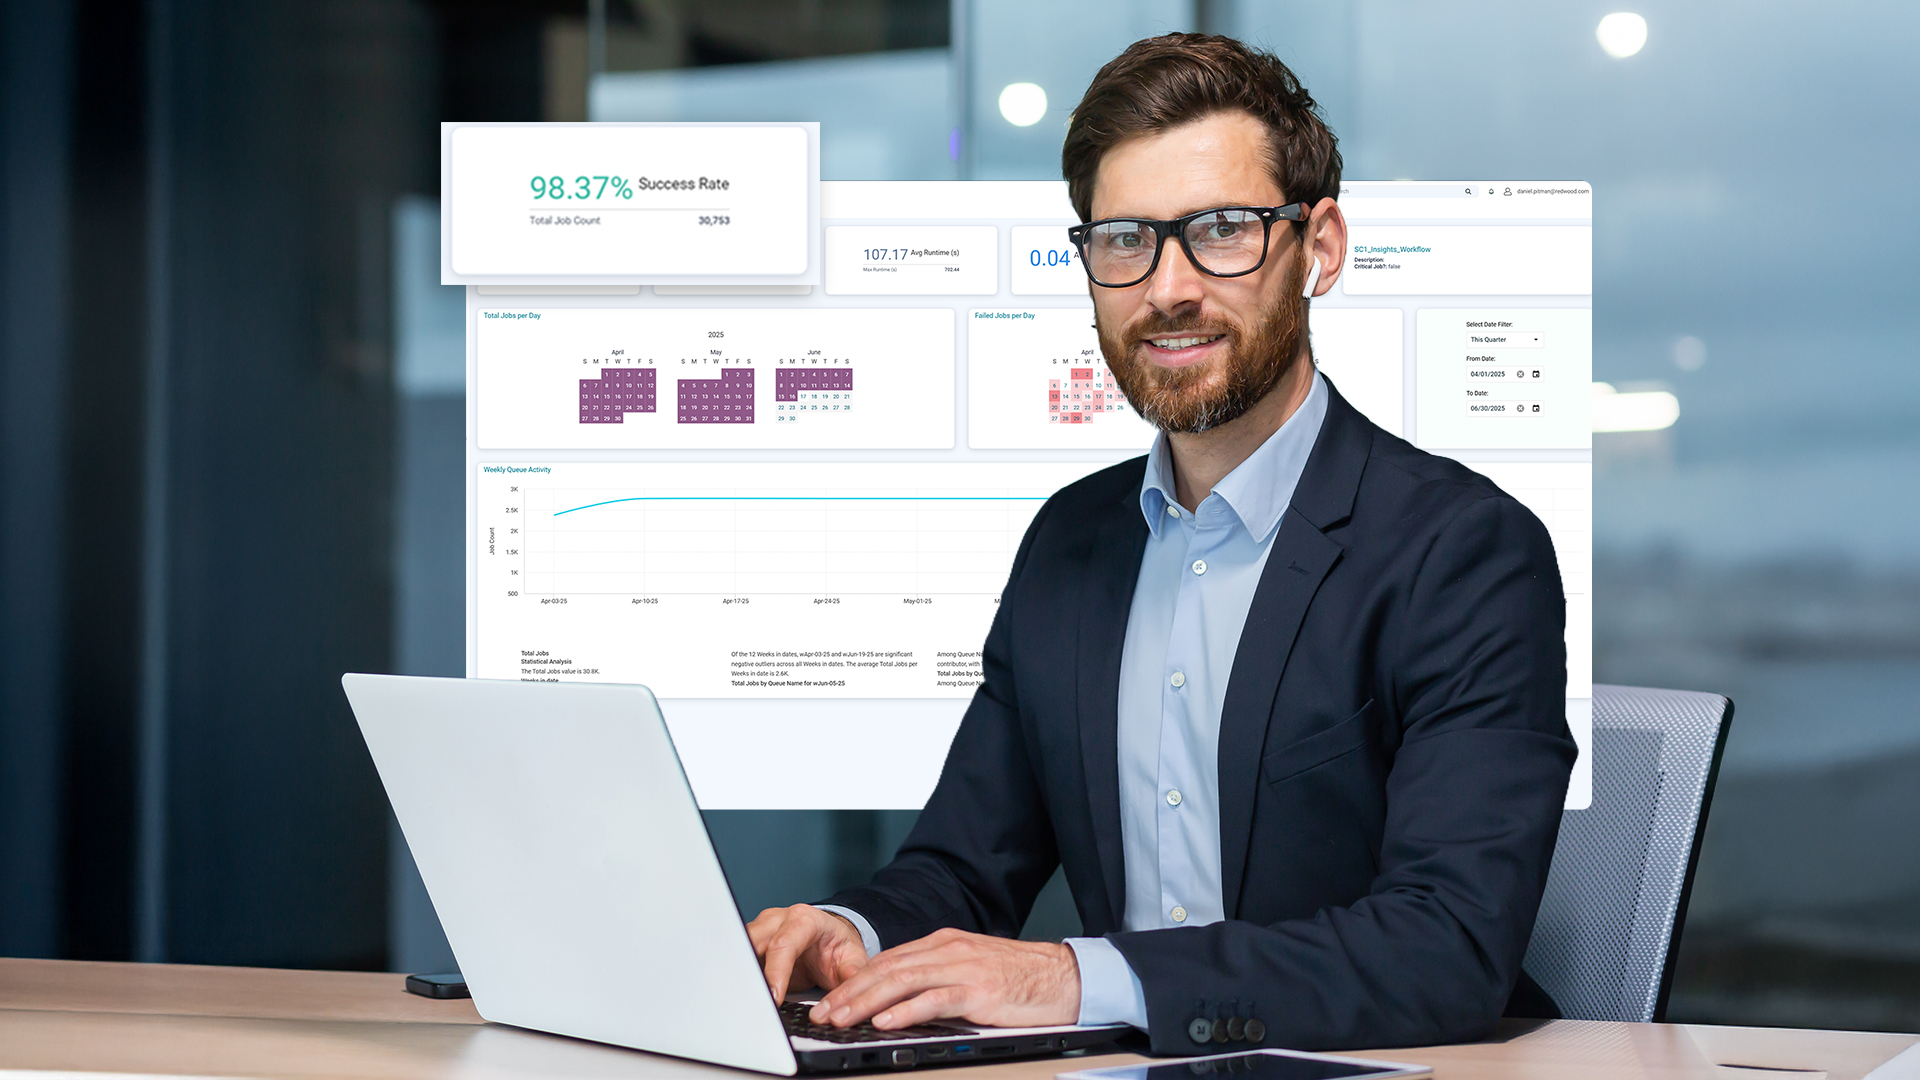
Advanced observability for resilient operations
Trade surface-level visibility for a high-fidelity understanding of your automation ecosystem, correlating telemetry across your entire stack.
-

Be informed, when and where it counts
Offer the context and key information to enable faster decisions, reduce ambiguity and deliver an integrated end-user experience.
-

Democratize orchestration
Provide tailored, persona-specific perspectives to give every stakeholder the data necessary to perform their next best action.
-

Secure mission-critical outcomes
Guarantee system performance for critical business processes with predictive SLA monitoring and automated recovery.
-

Accelerate analysis and optimization
Correlate workflow performance with wider application and infrastructure health to eliminate silos and keep teams informed.
-

Resolve issues faster
Slash mean time to resolution (MTTR) by converting raw telemetry — logs, metrics and traces — into context-aware troubleshooting to resolve latency or performance issues in record time.
-

Highlight successes
Build a cycle of continuous improvement using built-in dashboards to visualize gains and report on measurable successes of your automation strategy.
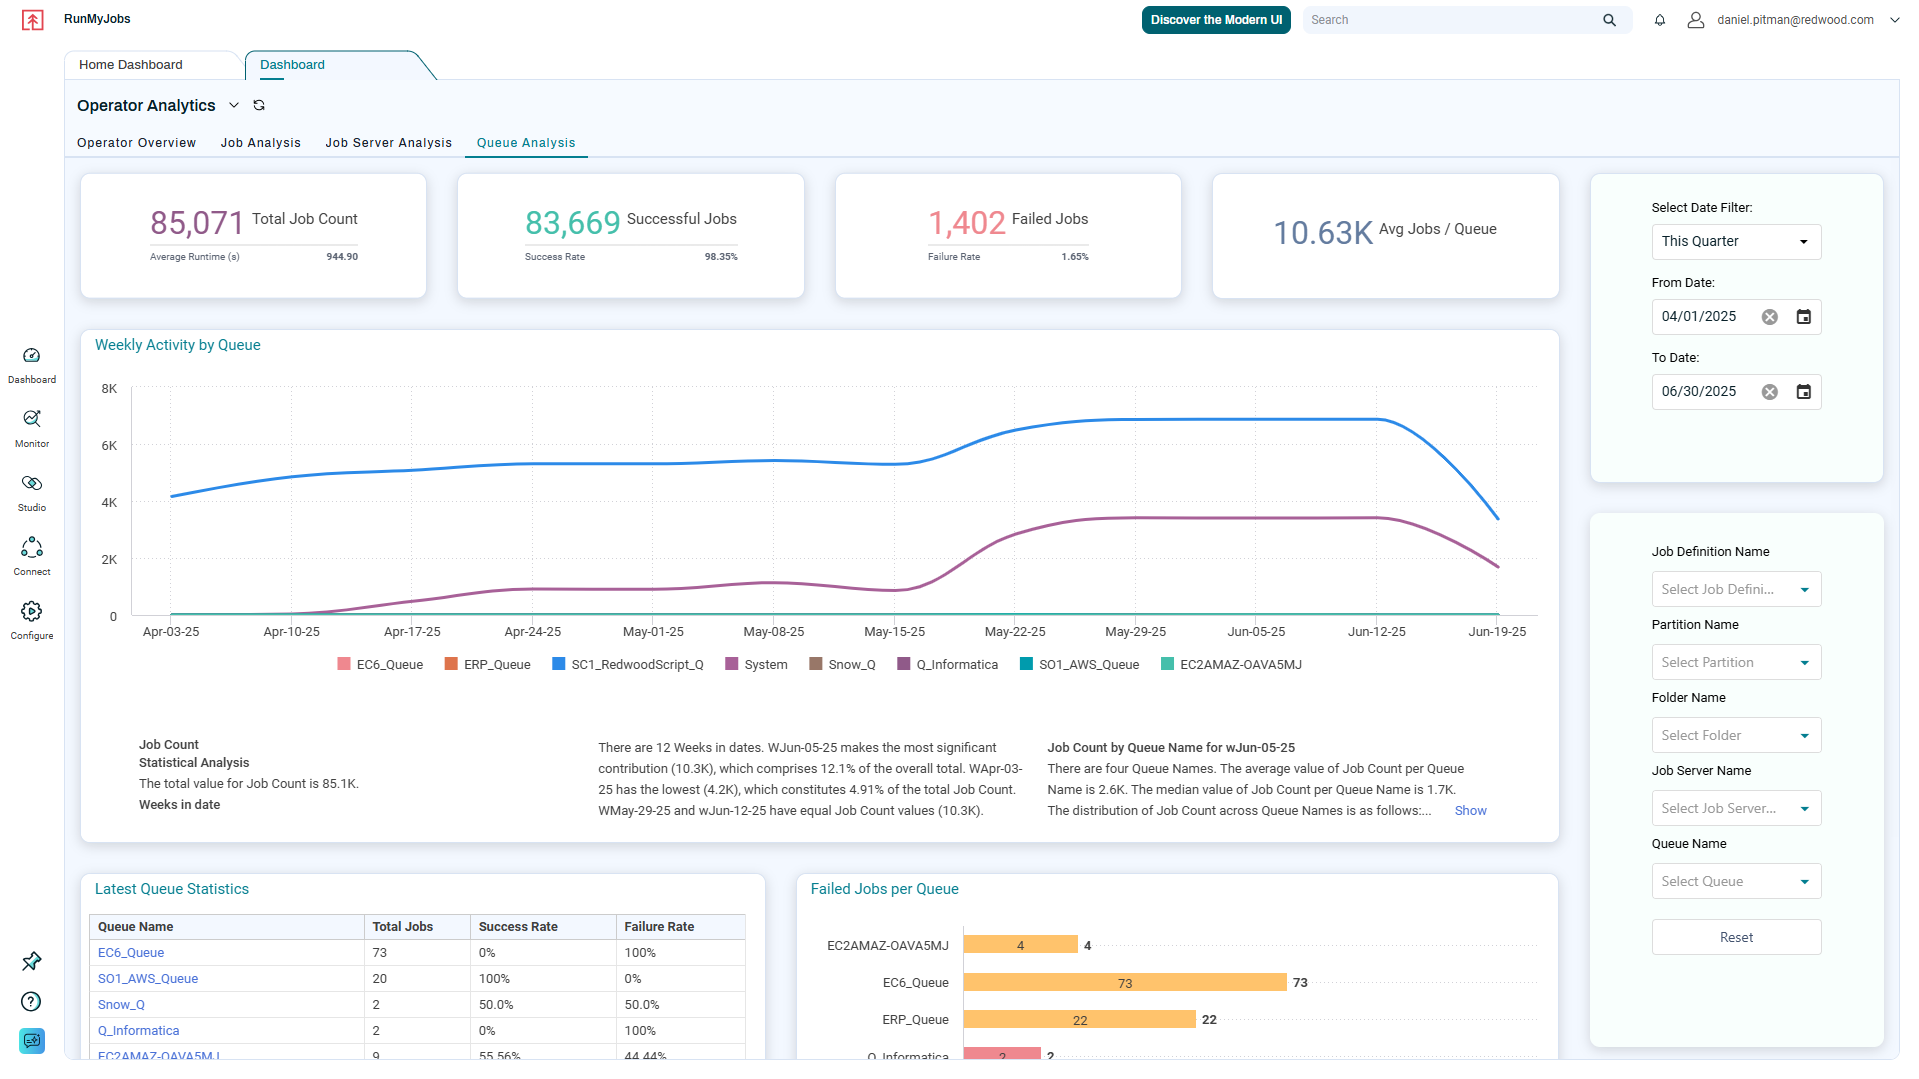
Product spotlight: The observability ecosystem
Preview powerful functionality, including AI-powered smart narratives, role-based dashboards, orchestration analytics.
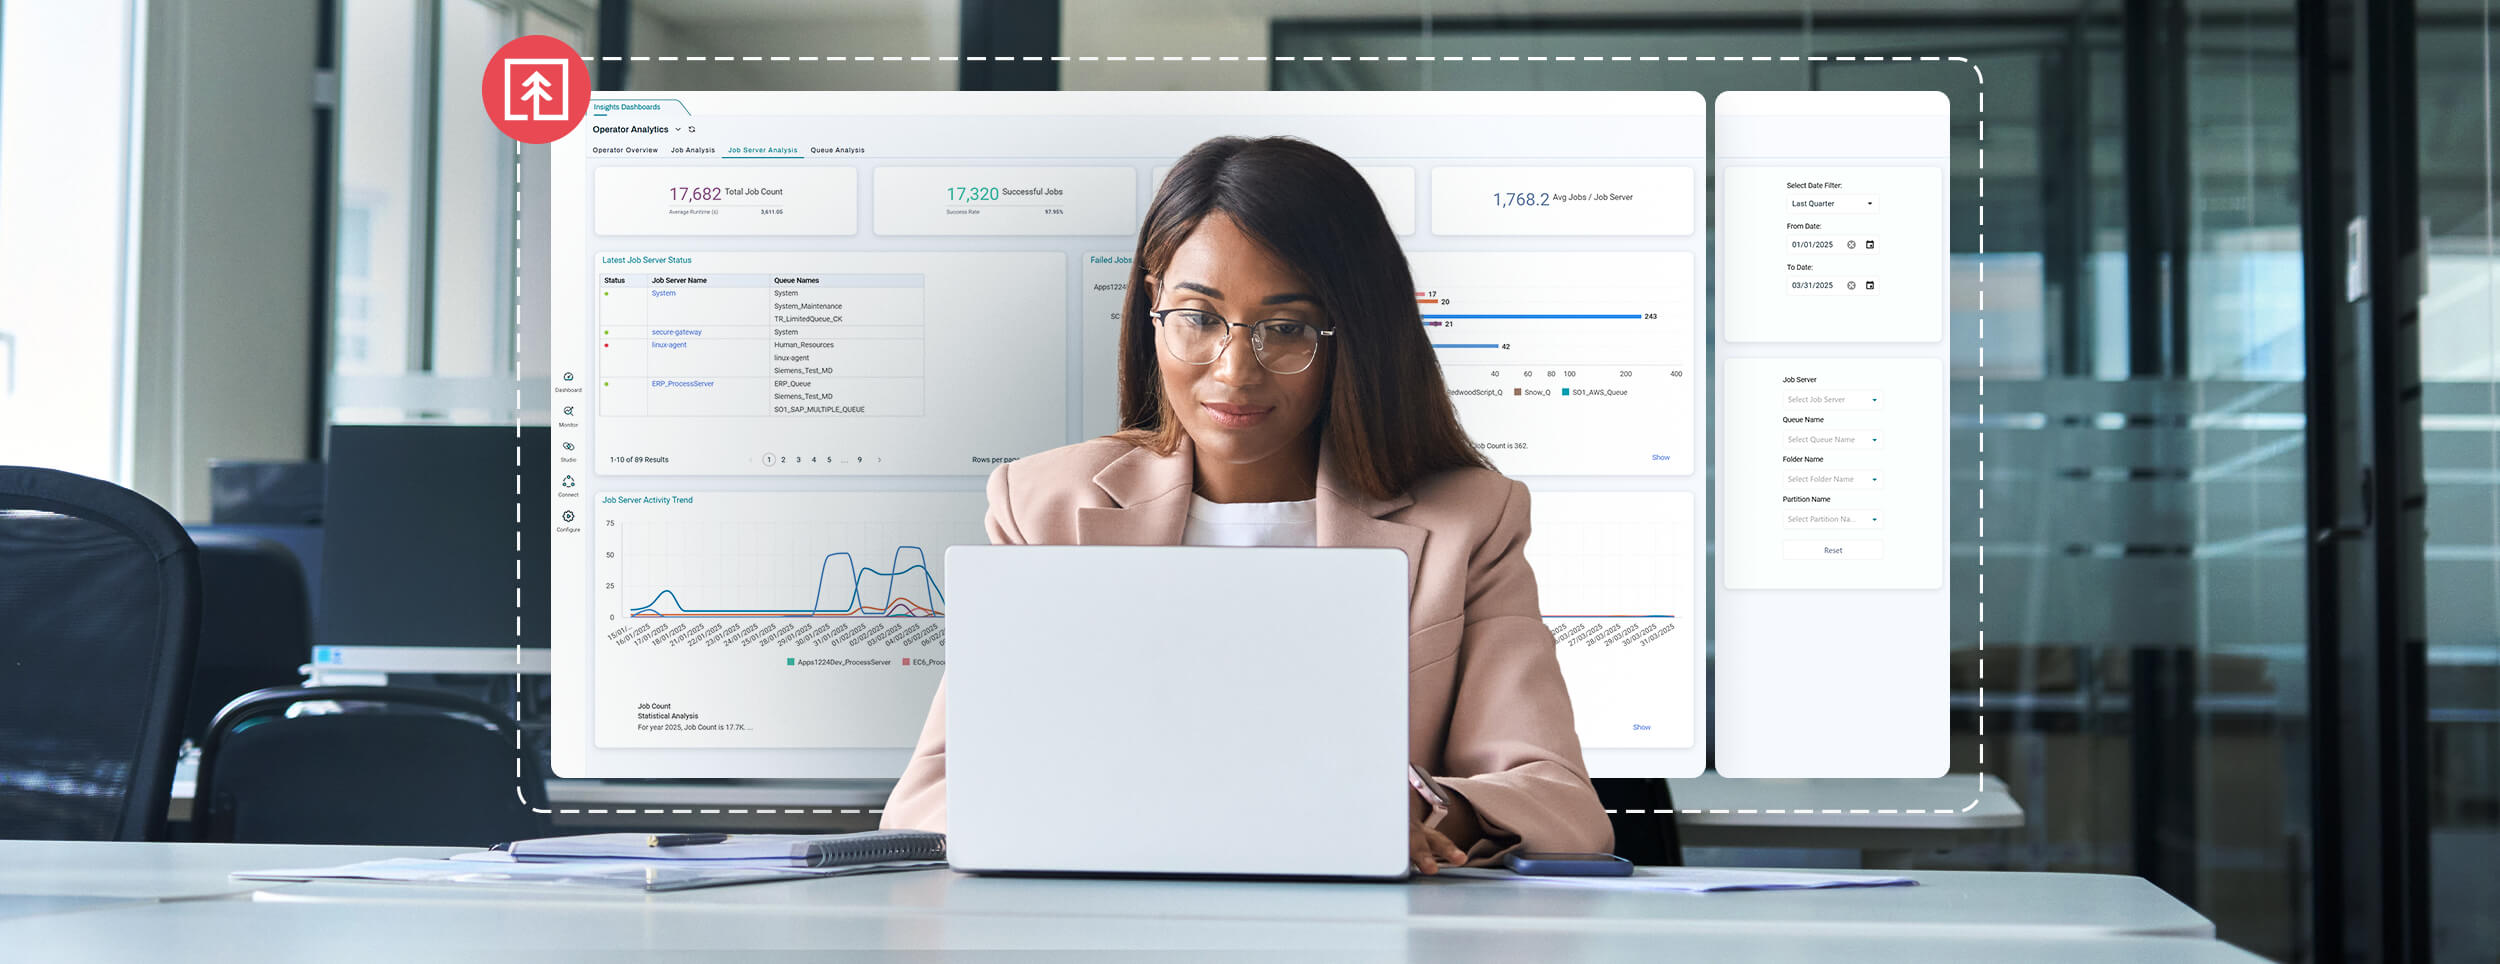
Operational intelligence without silos
Report, share, integrate and extend mission-critical health data across a transparent, observable Service Orchestration and Automation Platform (SOAP).
- Real-time dashboards highlight performance issues requiring immediate action
- Predictive SLA monitoring tools use machine learning to anticipate failures and trigger automated remediation
- Built-in business intelligence provides out-of-the-box dashboards for operations, optimization and compliance
- Extended features enable tailored views for specialized teams and stakeholders
- Observability integrations stream runtime telemetry to SAP Cloud ALM, Splunk, Dynatrace, New Relic and more for full stack correlation
- ITSM integrations connect automation health to service and incident management workflows
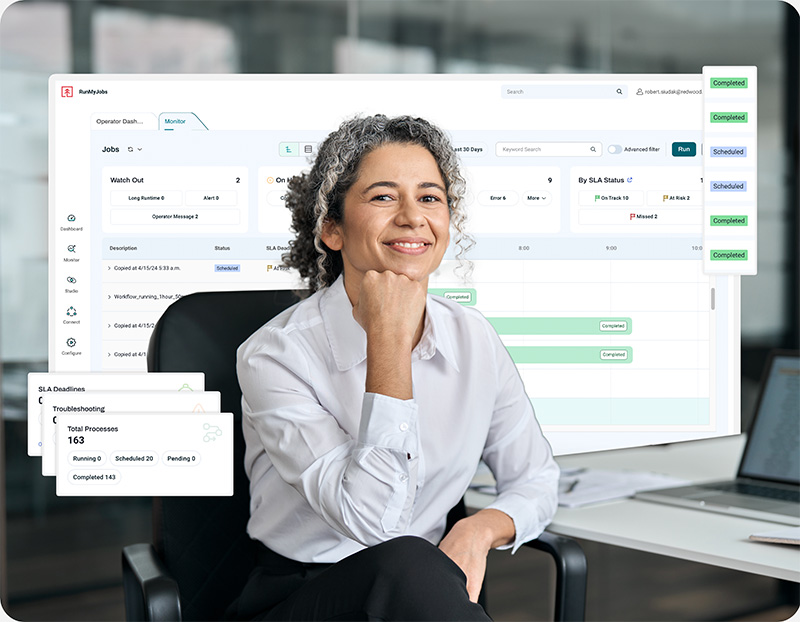
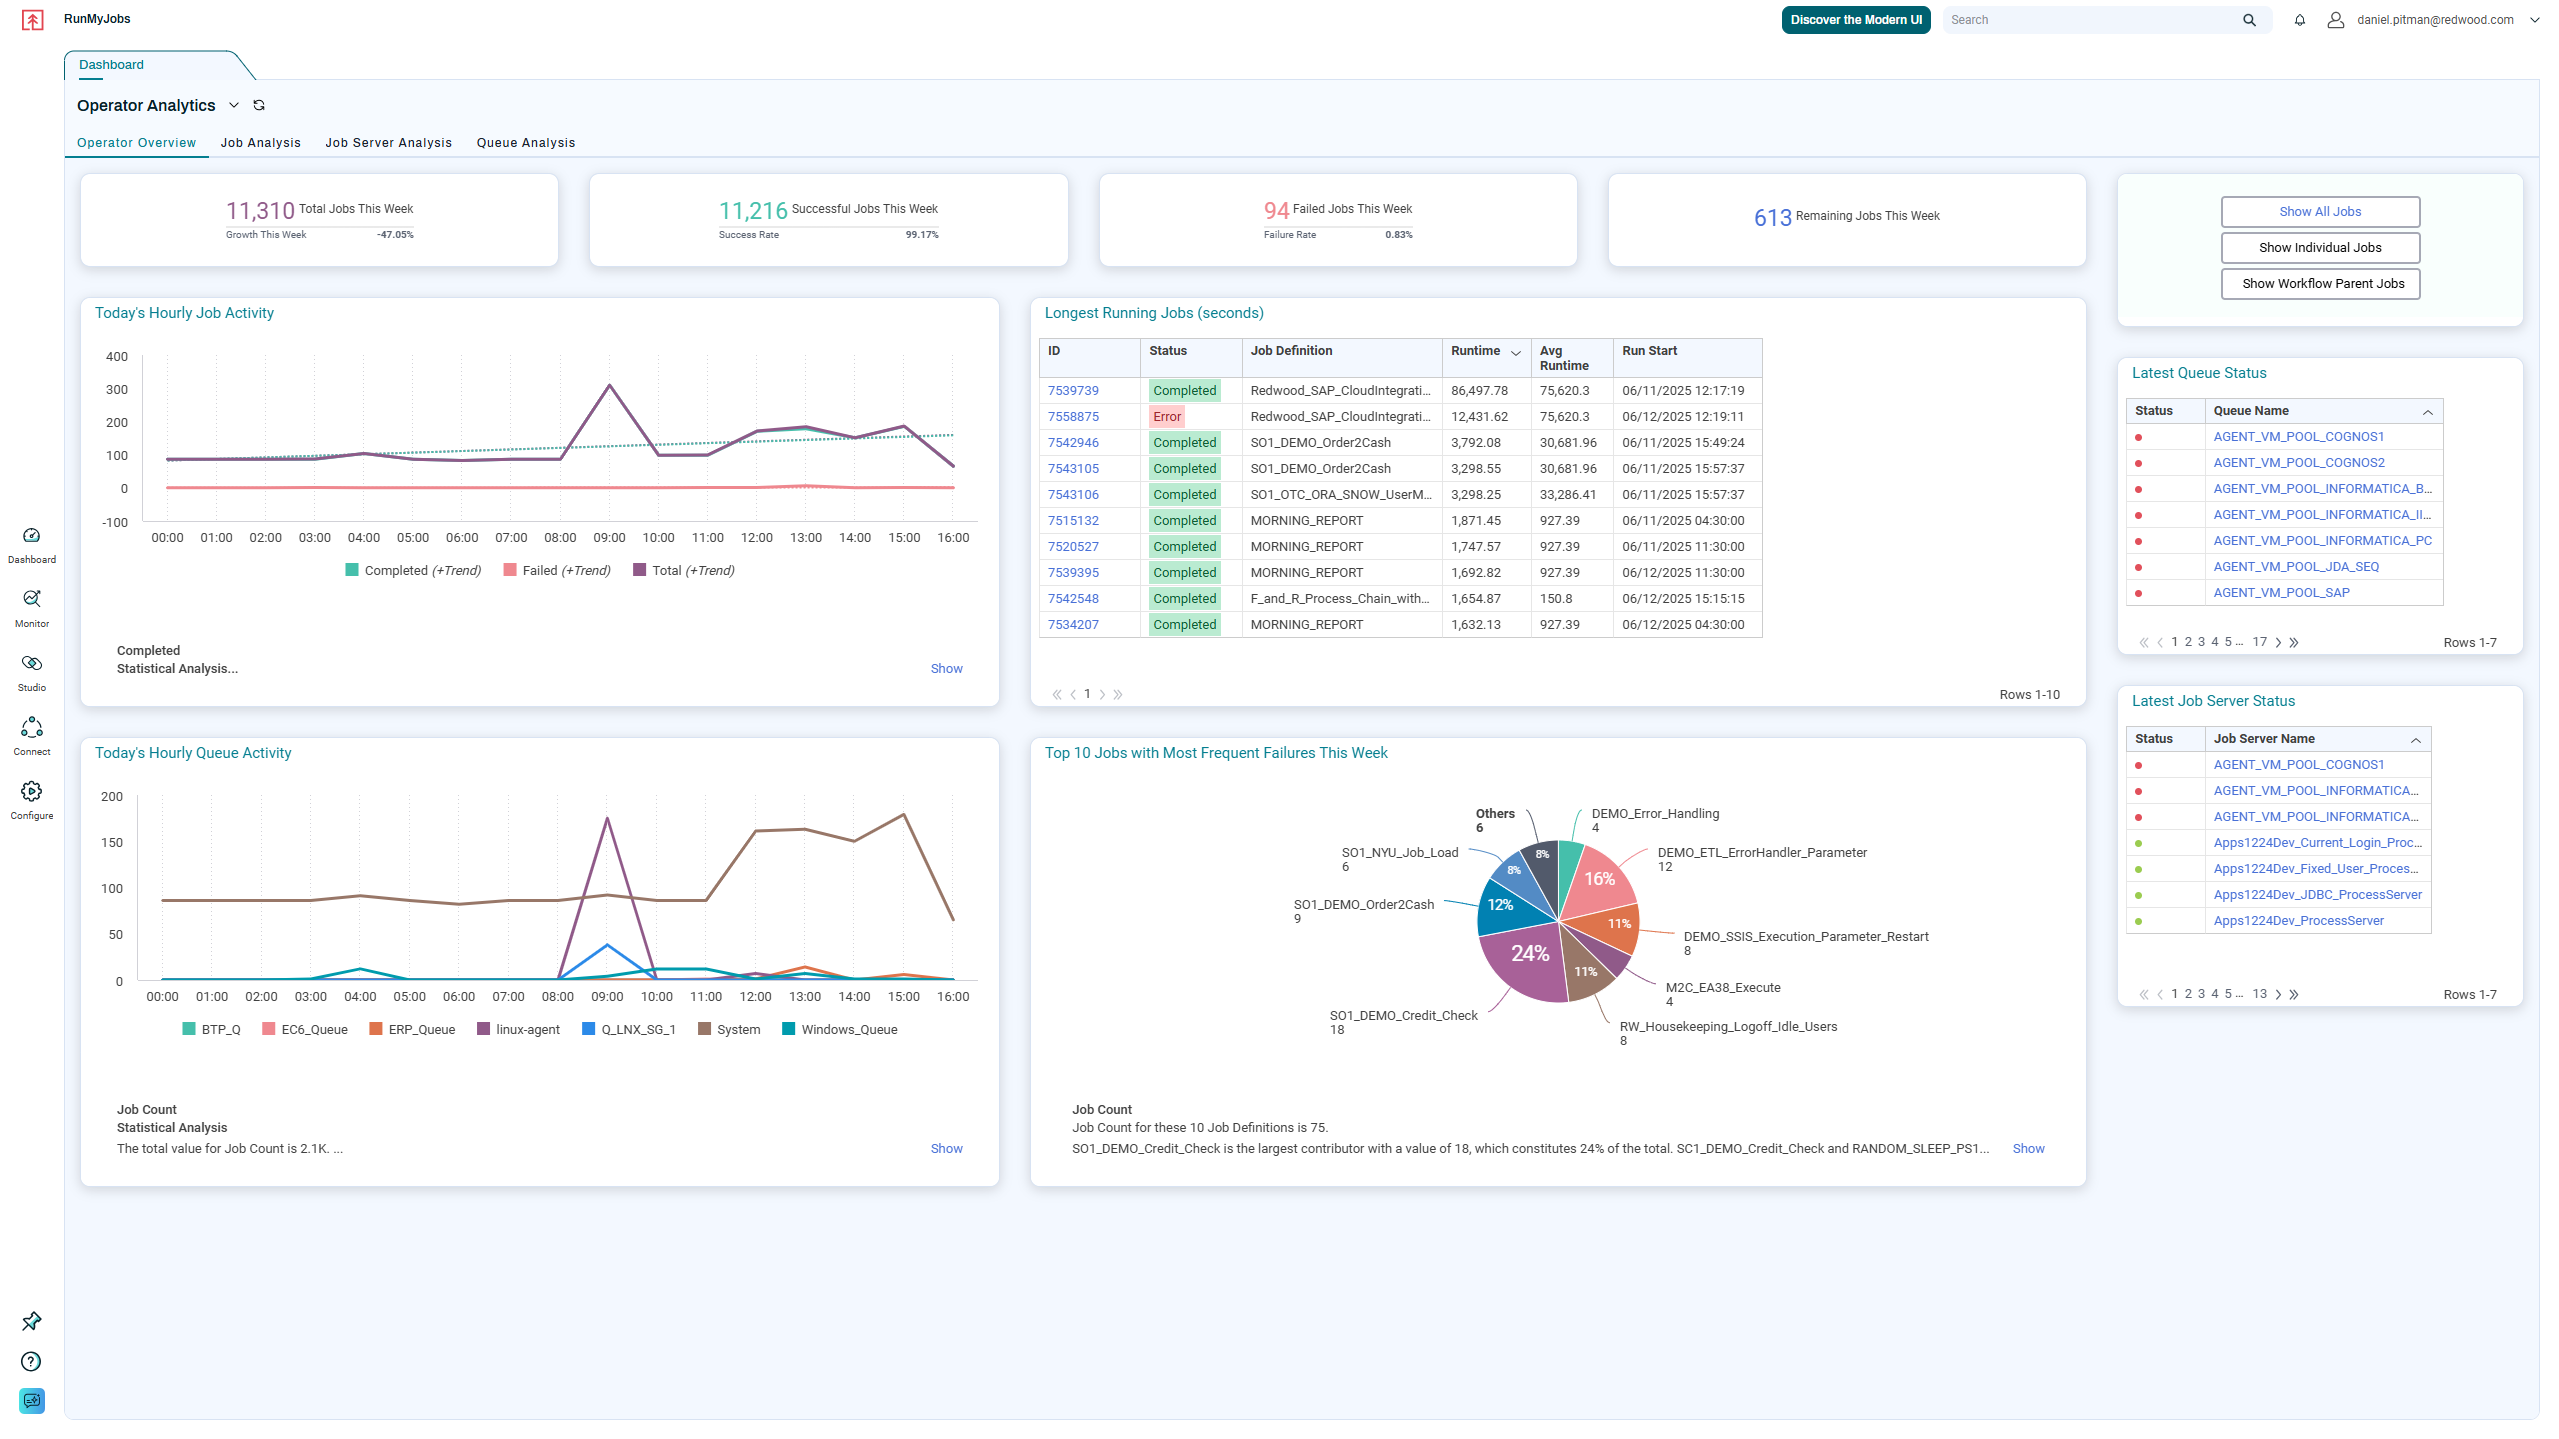
Tailored perspectives for every user
Gain out-of-the-box visibility with persona-specific dashboards and a unified feedback loop. With Redwood Insights (Standard and Premium), every stakeholder sees the data that drives their next best action.
- All users have access to centralized historical, status and performance metrics
- Operators gain real-time visibility into SLA adherence and delays, with tools to configure rules and take action
- Administrators have dashboards designed for governance and compliance, with easy data export
- Developers get faster insight into performance issues through comprehensive operational health views
- Specialized teams benefit from custom dashboards tailored to their needs
- Business stakeholders receive curated views focused on key metrics
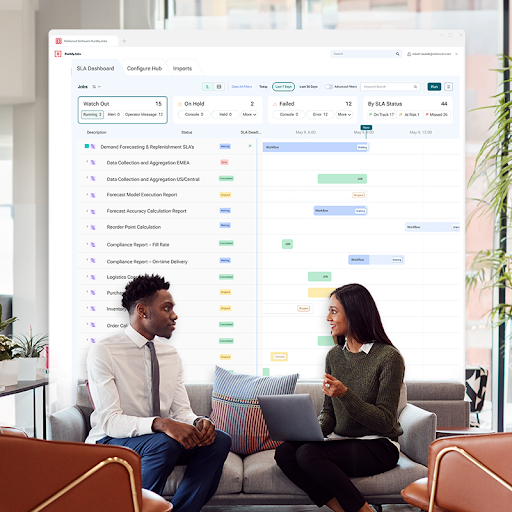
Predictive analytics for proactive automation
Shift from reactive monitoring to proactive intervention. Predictive analytics help teams anticipate downtime, prioritize remediation, and optimize workloads across hybrid, cloud-native, and on-premises environments.
- Visual SLA tracking with dedicated dashboards for monitoring process health and deadlines
- Business impact forecasting to prioritize corrective action using the predicted downstream delays
- Automated remediation via alerts, ITSM tickets or workflows when SLAs are at risk
- Data-driven benchmarking using extended data retention to optimize long-term performance
Continuous compliance across your environment
Assess governance and simplify compliance across all environments. Redwood Insights delivers audit-ready reporting and process intelligence to ensure environmental integrity.
- Auditor-specific views: Simplify compliance with dedicated views and downloadable, auditor-ready reports.
- 15-month data retention: (Premium) Maintain historical baselines necessary for complex year-over-year ROI and capacity planning.
- Immutable audit trails: Track all changes to automation artifacts, including object creation, updates, and deletions.
- Shared governance summaries: Reduce audit effort with dashboards demonstrating adherence to operational policies.
Integrated intelligence
Redwood Insights embeds observability directly into RunMyJobs, enabling teams to move from guesswork to data-driven optimization.
- Included features: Health overviews, failure clusters and contextual insights directly within the RunMyJobs interface
- Built-in dashboards: Tuned for operations, problem analysis and compliance
- Analytics and visualizations: Designed to surface problems and bottlenecks
- AI-powered smart narratives: Deeper views and data exploration
- Contextual actions: Easy transitions from dashboards to configurations
- Premium customization: Visualizations for any department built with an intuitive, no-code dashboard builder
- Historical analysis: Long-term trends informed by extended data retention
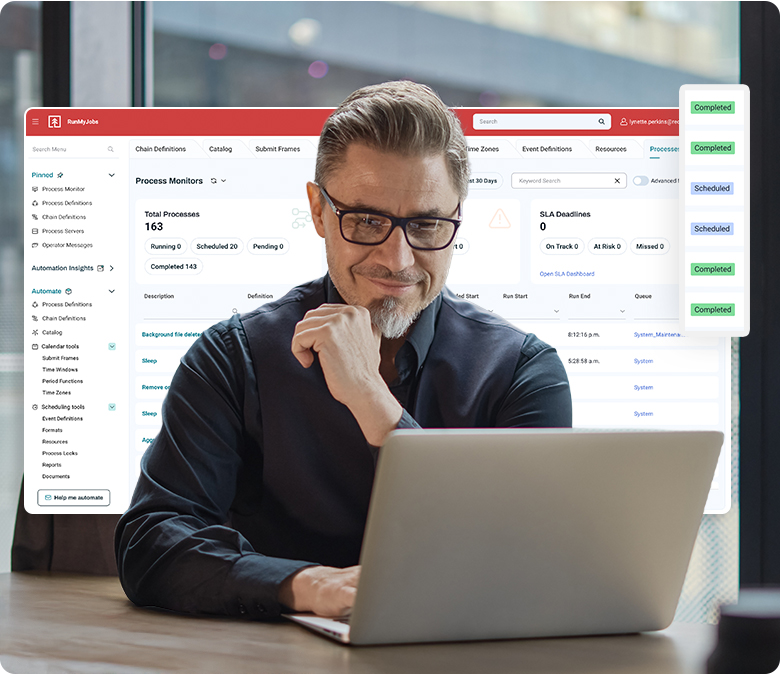
Enabling continuous improvement
Eliminate application performance monitoring (APM) silos and close the loop between incident resolution and long-term process optimization.
-

Respond to immediate issues
Use real-time dashboards to identify and resolve performance bottlenecks or failures as they happen, minimizing impact on the business.
-

Identify systemic patterns
Move beyond individual incidents with built-in reporting that surfaces failure clusters and recurring systemic issues that threaten long-term stability.
-

Correlate across the stack
Connect orchestration telemetry with the broader ecosystem, including SAP Cloud ALM, Splunk, Dynatrace and more.
-

Analyze root causes
Leverage heat maps and AI-powered smart narratives to facilitate deep root-cause analysis, identifying exactly where processes can be optimized for better throughput.
-

Govern and track activity
Maintain transparency throughout the improvement process with an admin view that traces audited object activity, ensuring changes are secure and documented.
-

Benchmark and monitor the loop
Use extended historical data to benchmark improvements against your baseline, ensuring optimizations deliver lasting reliability and efficiency.
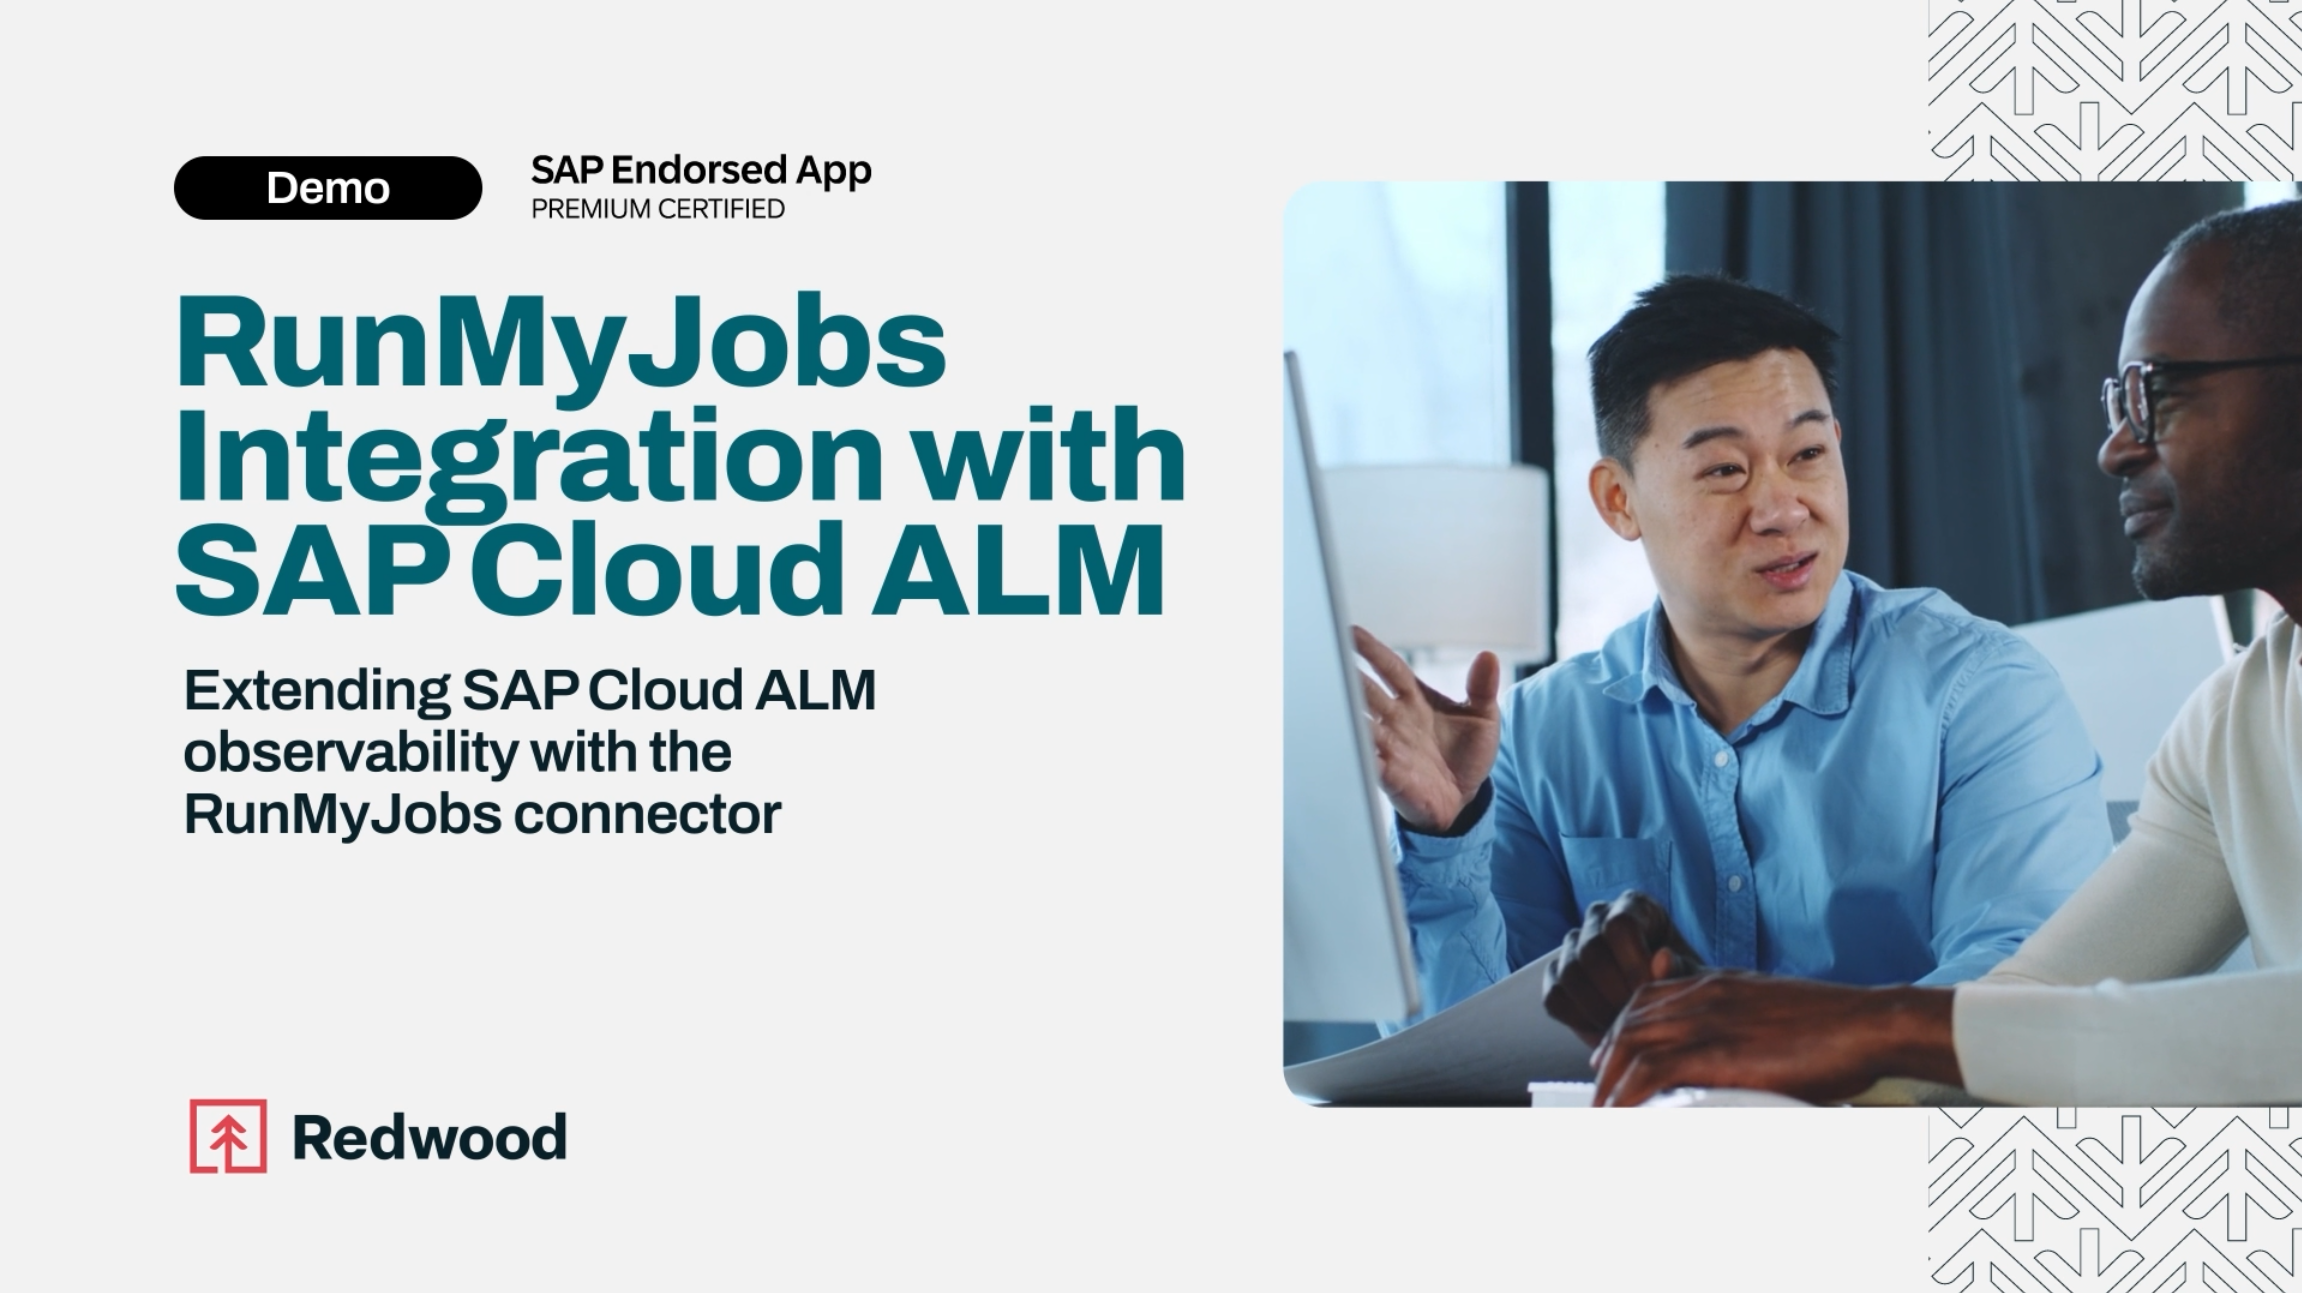
Monitor RunMyJobs workflows from SAP Cloud ALM
The SAP Cloud Application Lifecycle Management (ALM) connector for RunMyJobs synchronizes automation and orchestration data directly into SAP Cloud ALM Job and Automation Monitoring. Empower your SAP team to monitor workflows from a single command center and drill back to RunMyJobs in just one click to take action and resolve issues.
End-to-end monitoring FAQs
What's the difference between monitoring and observability?
Monitoring and observability are closely related but serve different purposes in managing IT infrastructure. A monitoring platform tracks predefined thresholds, metrics and logs — like error rates, response times and system uptime — to alert teams when something goes wrong. Monitoring is reactive by nature: it tells you that a problem exists.
Observability, on the other hand, is proactive. A modern observability platform gives you a comprehensive, real-time understanding of the internal state of your systems by analyzing outputs like logs, metrics and traces. Embedded observability in workload automation software makes it possible to detect anomalies earlier, correlate issues across applications and understand why something broke without needing to reproduce the error. Observability enables DevOps and IT operations teams to move from reactive fixes to continuous improvement across complex IT environments, whether you're running SaaS, on-premises or hybrid workloads.
What is predictive analytics?
Predictive analytics uses machine learning and historical data to forecast future outcomes, helping IT teams anticipate issues before they impact performance. Within an observability platform, predictive analytics can detect patterns in real-time data, such as rising error rates or unusual response times, and signal when a process is likely to fail or a threshold is about to be breached.
When integrated into workload automation and monitoring platforms, predictive analytics allows for smarter decision-making across critical business systems, from web applications to back-end scheduling. This enables proactive management of automation processes, reduces downtime and supports long-term optimization of your IT infrastructure.
What is ITSM problem management?
IT service management (ITSM) problem management is the structured process of identifying and eliminating the root causes of recurring incidents in your IT infrastructure. Unlike incident management, which is focused on quickly resolving issues when they arise, problem management aims to prevent those incidents from happening in the first place.
An observability platform embedded within workload automation software is a powerful tool for ITSM problem management. It offers visibility into historical data and system behavior, helping teams spot trends, uncover hidden relationships between failures and prioritize fixes based on business impact. By reducing repeat incidents and improving system reliability, integrated problem management drives greater efficiency across DevOps, support and infrastructure teams.
What is important to monitor for workload automation?
For effective workload automation, it’s essential to monitor several key aspects. These include job status, execution times and resource utilization. Monitoring job status helps track the progress and completion of automated tasks, ensuring that any failures or delays are promptly addressed. Execution times provide insights into performance trends, helping identify any bottlenecks or inefficiencies in the automation process.
Resource utilization is also crucial, as it involves monitoring CPU, memory and storage usage to ensure optimal performance and avoid overloading a system. Tracking dependencies between tasks and workflows is also important to prevent cascading failures and maintain the overall reliability of the automation system. By leveraging observability tools and monitoring systems, IT teams can gain comprehensive visibility into their workload automation environments and facilitate efficient and reliable operations.
Envisage the future of workload automation management.
Upgrade your automation
Explore what’s possible with enterprise-grade orchestration.

Solutions
Company

© 2026 All Rights Reserved